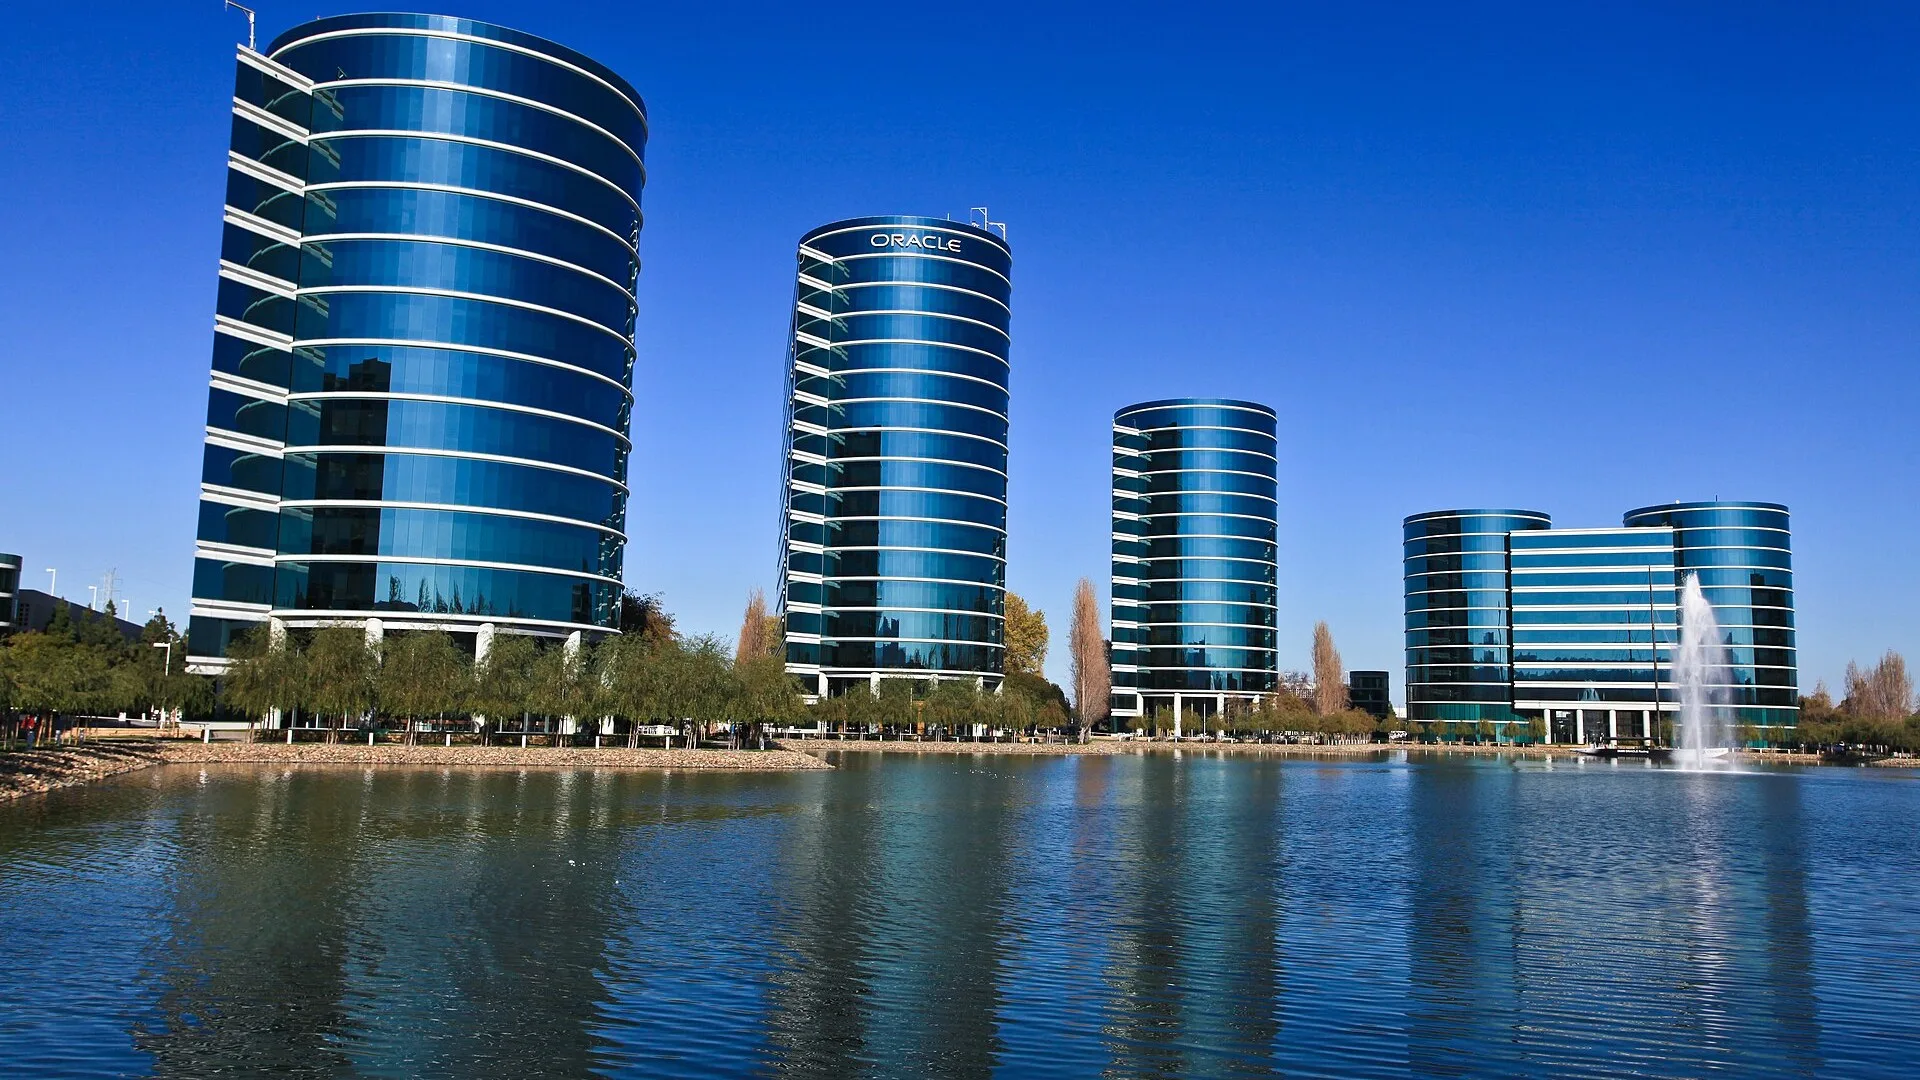
Oracle’s business had the best year in its history and its shareholders had one of the worst. That is not a figure of speech. Over the twelve months to 31 May 2026, Oracle’s contracted backlog — the revenue it has already signed and not yet delivered — rose from $137.8bn to $638.0bn, a 363% increase, according to the company’s own 10-K filings. Over almost exactly the same window the shares fell 39.2%. ORCL trades at $142.45, down 56.6% from its closing peak of $328.33 on 10 September 2025. A bull case at $245 needs 72% upside and sits on the analyst consensus target of $246.43. A bear case at $95 needs a 33% decline.
The reason both cases are live comes down to a single line in the cash flow statement that most coverage skips. In fiscal 2026 Oracle spent $55.7bn on property, plant and equipment while generating $32.0bn in operating cash flow. That is capital expenditure running at 174% of operating cash flow, and it means free cash flow was roughly negative $23.7bn for the year. For scale, FinanceFeeds reported that the five US hyperscalers are collectively expected to spend around 93% of operating cash flow on capex in 2026, as part of AI’s $697bn spending boom entering its payback phase. Oracle is running at nearly double the ratio of the group it is trying to catch — including Amazon, whose own capex plan runs to roughly $220bn. The backlog is real, the cash to build for it is being borrowed, and the market has decided it does not want to fund the gap at 2025 prices.
Key facts
- ORCL: $142.45, down 2.74% on the session — StockAnalysis, close of 24 August 2026
- Backlog (remaining performance obligations) of $638.0bn at 31 May 2026, up from $137.8bn a year earlier — Oracle 10-K via SEC EDGAR, filed 22 June 2026
- FY2026 capex $55.7bn against $32.0bn operating cash flow, implying roughly −$23.7bn free cash flow — Oracle 10-K via SEC EDGAR
- Revenue $67.36bn (+17.3%), net income $16.98bn (+37.3%), EPS $5.83 (+34.3%) on a trailing basis — StockAnalysis, 25 August 2026
- Total debt $167.4bn, up from $109.0bn a year earlier; net debt $135.5bn — StockAnalysis balance sheet data, 25 August 2026
- Trades at 24.4x trailing and 17.7x forward earnings, with a $2.00 dividend yielding 1.40% — StockAnalysis, 25 August 2026
- Analyst consensus: Buy, $246.43 target, implying 73% upside — StockAnalysis, 25 August 2026
What actually happened to the share price
The chart of the last twelve months is one of the more dramatic mega-cap round trips in recent memory.
Oracle closed at $328.33 on 10 September 2025, the day after the quarter in which backlog jumped from $137.8bn to $455.3bn. That single disclosure re-rated the company from an enterprise software incumbent into an AI infrastructure play, and the shares gapped accordingly. Everything since has been the market re-underwriting that decision. The stock bottomed at $114.99 on 24 July 2026, staged a recovery to the mid-150s, and has drifted back to $142.45.
What makes the decline unusual is that it has happened through a run of good results. Oracle has beaten consensus earnings per share in each of its last four quarters: $1.47 against $1.35 expected, then $2.26 against $1.50, then $1.79 against $1.55, then $2.11 against $1.89 in the fourth quarter reported on 10 June 2026. Four beats, two of them substantial, and a share price down 39% over the period. That pattern is not unique to Oracle this cycle — FinanceFeeds found the same disconnect at Nvidia, where the stock fell in the five sessions after each of its last four earnings beats. Whatever is driving this, it is not an earnings disappointment.
The next test comes soon. Oracle has reported first-quarter results in the second week of September in each of the last several years — 9 September in both 2024 and 2025 — and the current estimate is 8 September 2026, with consensus at $1.67 of EPS on about $19.13bn of revenue. That date is an estimate rather than a company-confirmed announcement at the time of writing, so treat it as approximate.
What the analysts and the practitioners are actually saying
The independent commentary has split along a clean line: those focused on the multiple, and those focused on the cash.
Parkev Tatevosian, CFA, in a 22 August analysis, made the valuation case while explicitly conceding the cash problem. He noted that Oracle “is now trading at a forward price to earnings of just 13.5 which is lower than where the stock has traded for historically” — his own calculation, which runs below the 17.7x forward multiple StockAnalysis shows on current-year estimates, so the exact figure depends on which fiscal year you anchor to. More importantly, he flagged that “Oracle is forecasting revenue growth to accelerate to 34% in fiscal year 2027” while “the forecast suggests that Oracle’s cash flow will remain significantly negative in fiscal year 2027, even though the company’s revenue will likely” continue climbing. That is the bull and bear case in one breath: accelerating growth funded by negative cash flow.
Sven Carlin, Ph.D. made the long-horizon argument in a 4 August video viewed more than 14,000 times, reaching for the obvious historical parallel: “If we look at Oracle in the 2000s, crashed 80% and then it kept doing its thing.” His framing is that the capex cycle has to finish before the equity works — “once profitability of free cash flow returns significantly, that year companies like Meta, Amazon, and probably Oracle will do extremely well.” That is a thesis with a timing problem attached rather than a valuation one.
On the bearish side, commentary circulating in early August focused on Oracle’s purchase commitments and on credit risk tied to its largest AI customers. A widely shared claim attributing a specific bearish call on Oracle to investor Michael Burry could not be independently verified for this article, and is noted here only because it shaped sentiment, not as an established fact. The underlying concern, however, is verifiable from Oracle’s own filings: the company has taken on $58bn of incremental debt in a single year to serve contracts whose counterparties are concentrated and, in several cases, themselves loss-making.
The two cases, priced
Here is what each scenario requires in multiple terms, using the $8.05 of forward earnings per share implied by the current price and forward multiple.
| Scenario | Price | Move from $142.45 | Implied market cap | Forward P/E |
|---|---|---|---|---|
| 52-week closing high | $328.33 | +130.5% | ~$945bn | ~40.8x |
| Analyst consensus target | $246.43 | +73.0% | ~$710bn | ~30.6x |
| Bull case | $245 | +72.0% | ~$706bn | ~30.4x |
| Today | $142.45 | — | $410bn | 17.7x |
| 52-week closing low | $114.99 | −19.3% | ~$331bn | ~14.3x |
| Bear case | $95 | −33.3% | ~$274bn | ~11.8x |
The table exposes what is genuinely different about Oracle compared with the speculative end of the AI trade. Unlike a pre-revenue quantum or fusion story, there is a price at which Oracle is objectively cheap on earnings. At $95 the company would trade near 11.8 times forward earnings while growing EPS in the mid-thirties — a multiple normally reserved for businesses in decline. Even at today’s $142.45 the stock sits at 17.7x forward, below the market multiple, for a company whose net income grew 37.3%.
The catch is that earnings multiples assume the earnings convert to cash, and right now they emphatically do not. Oracle earned $16.98bn of net income and produced negative free cash flow of roughly $23.7bn, because $55.7bn went into data centres. A multiple is only a valuation tool when the E turns into distributable cash within a reasonable horizon. For Oracle, that horizon is the entire debate.
The structural tension: a backlog you cannot bank
Remaining performance obligations are the most misunderstood number in this story, and both bulls and bears overreach on them.
The bull overreach is treating $638.0bn as if it were money in the bank. It is not — it is contracted revenue that Oracle must still build capacity to deliver. Against trailing revenue of $67.36bn, that backlog represents roughly 9.5 years of current revenue, which tells you immediately that it cannot be converted without an enormous, sustained construction programme. The $55.7bn of capex is not optional spending; it is the cost of honouring the backlog. Every dollar of RPO carries a capital obligation behind it.
The bear overreach is dismissing the backlog as vapour. It is contracted, it is disclosed in audited filings, and it grew again in the most recent period — from $552.6bn at 28 February to $638.0bn at 31 May 2026. Companies do not sign $638bn of obligations they expect to walk away from, and Oracle’s auditors would have something to say about the disclosure if the counterparties were not creditworthy in aggregate.
The honest reading sits between the two. The backlog converts to revenue over many years, at a gross margin that is lower than Oracle’s traditional software business, funded by debt that has grown from $109.0bn to $167.4bn in twelve months. The equity is the residual claim on that spread, which is why it moves so violently. Note what the debt does to the arithmetic: Oracle’s market capitalisation fell 37.9% over the year, but adding net debt of $135.5bn, its enterprise value fell closer to 28%. Because the debt grew while the equity shrank, shareholders absorbed roughly 1.35 times the decline in the value of the whole business. Leverage cuts in both directions, and on the way down it has been cutting.
What happens next
One: the September quarter is about capex guidance, not EPS. Consensus is $1.67 on roughly $19.13bn of revenue, and Oracle has beaten four quarters running, so another EPS beat should be the base case. It will not matter much. The number that moves the stock is the fiscal 2027 capital expenditure figure and any commentary on when free cash flow turns positive. A capex guide above the roughly $55.7bn run rate would confirm the bear thesis that the build never stops; a guide that flattens is the single most plausible catalyst for a re-rating toward the bull case.
Two: the bull case depends on multiple expansion, not earnings. Reaching $245 requires roughly 30x forward earnings against today’s 17.7x. Since consensus EPS is unlikely to move 70% in a year, essentially the entire move has to come from investors paying more for the same earnings. That happens when free cash flow inflects, and on the company’s own trajectory that is a fiscal 2028 event at the earliest. The analyst consensus target of $246.43 is therefore a call on sentiment normalising, not on a new forecast.
Three: the bear case runs through the credit market, not the equity market. With $167.4bn of total debt and negative free cash flow, Oracle’s funding cost is now a live variable. A downgrade, a widening in its spreads, or a stumble at one of its large AI counterparties would force the equity to reprice regardless of what the income statement shows. Watch the debt, not the EPS line — that is where the $95 scenario originates, and it would most likely arrive through the July low of $114.99 failing rather than through a bad quarter.
The practical framing: Oracle is no longer a software company being valued on software metrics, and it is not yet an infrastructure company producing infrastructure cash flows. It is in the expensive middle of a transition it has already sold $638bn of contracts to justify. At 17.7x forward earnings the market is pricing meaningful execution risk into a business growing earnings in the mid-thirties. That is either the opportunity or the warning, and the September capex guide is the first real chance to find out which. For a comparison of how the market is pricing the picks-and-shovels side of the same build-out, see FinanceFeeds’ Marvell bull-versus-bear breakdown.
Frequently asked questions
What is the Oracle stock prediction for 2026?
The bull case is $245, matching the analyst consensus target of $246.43 and implying 72% upside from $142.45. The bear case is $95, a 33% decline that would take the stock below its July 2026 low of $114.99. The nearest catalyst is first-quarter fiscal 2027 results, currently estimated for 8 September 2026.
Why has Oracle stock fallen so much?
ORCL is down 56.6% from its closing peak of $328.33 in September 2025 despite beating earnings in four consecutive quarters. The decline reflects the cost of its AI build-out rather than weak results: fiscal 2026 capital expenditure of $55.7bn against $32.0bn of operating cash flow produced roughly negative $23.7bn of free cash flow, funded by debt that rose from $109.0bn to $167.4bn.
What is Oracle’s backlog and does it matter?
Oracle’s remaining performance obligations reached $638.0bn at 31 May 2026, up from $137.8bn a year earlier. That is roughly 9.5 years of current revenue. It is contracted and disclosed in audited filings, but it converts to revenue only as Oracle builds the data centre capacity to deliver it, which is precisely what the capital expenditure is funding.
Is Oracle stock cheap at current levels?
On earnings, yes by historical standards: 24.4x trailing and 17.7x forward, for a company that grew net income 37.3% and EPS 34.3%. On cash flow, no — free cash flow was roughly negative $23.7bn in fiscal 2026. Whether the multiple is cheap depends entirely on when that cash flow inflects.
When does Oracle report earnings?
Oracle has reported first-quarter results in the second week of September in recent years, including 9 September in both 2024 and 2025. The current estimate for Q1 fiscal 2027 is 8 September 2026, with consensus of $1.67 EPS on about $19.13bn of revenue. This date had not been confirmed by the company at the time of writing.
What would invalidate the bull case for Oracle?
Fiscal 2027 capital expenditure guidance above the current $55.7bn run rate, with no visible path to positive free cash flow, would confirm that the build-out keeps consuming the earnings. A credit downgrade or trouble at a major AI counterparty would do the same faster, since Oracle now carries $167.4bn of total debt. This article is analysis, not investment advice.