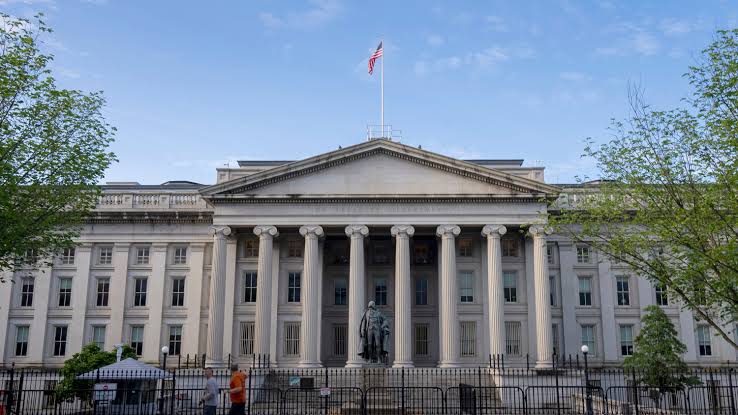
The US Treasury is about to buy back a lot more long-dated debt, and the precious-metals market has been front-running the move for two weeks. On August 19, Treasury said it would at least double the maximum size of its liquidity-support buyback operations in the long end of the curve, and the bigger operations begin September 9. Gold and silver jumped on the announcement and have held most of those gains since, even though the actual larger purchases have not started yet.
What has moved metals so far is anticipation of a policy that has barely begun, layered on top of record US debt, a softer dollar, and a long-running structural supply squeeze in silver. Whether the rally has staying power depends on what happens after September 9 and on a Federal Reserve now pulling in the opposite direction.
What Treasury Announced and When the Bigger Operations Actually Start
In its August 19 release, Treasury said the maximum size of its buyback operations in the 10-to-20-year and 20-to-30-year sectors rises from $2 billion to at least $4 billion per operation, “by at least double.” The change takes effect September 9 and runs through November 4, when the next Quarterly Refunding will set future sizes. Treasury framed it as providing “greater liquidity support” in long-dated sectors where it sees strong demand, not as an effort to suppress yields.
On the announcement, gold jumped as much as 4.3% to about $4,525 and silver climbed 5% to 6.4% to near $68, with the 30-year yield dropping around 10 basis points, according to 24/7 Wall St. But the bond move faded quickly. The 10-year yield, around 4.68% before the announcement, initially fell and then rebounded back above its pre-announcement level within days, and it sits at 4.72% now. Metals kept their gains while the yield move that supposedly drove them unwound, which is the first sign that the rally is running on narrative more than mechanism.
Why Lower Long-End Yields Lift Gold and Silver
The link between the buyback and the metal is opportunity cost. Gold and silver pay no interest, so when long-dated yields fall, the income an investor gives up to hold metal instead of bonds shrinks, and metal becomes relatively more attractive. Because the buyback targets the 10-to-30-year sectors specifically, the long end is the part of the curve that matters here, and that is where yields have eased even as shorter maturities rose.
Over the past month, US Treasury yields rose across the front and belly of the curve but fell at the 20- and 30-year maturities the buyback program targets, a modest easing that helps explain the metals bid. Source: TradingEconomics (as of Aug 31) · Chart: FinanceFeedsAfter the August 19 announcement, CNBC reported that Treasury Secretary Scott Bessent could tap the roughly $935 billion Treasury General Account to fund purchases of older, higher-yielding securities, a maneuver he called a “Treasury Twist,” as relayed by Mining.com, though officials would not say how much of the cash pile would be used. Not everyone is convinced this is sound policy.
As FinanceFeeds detailed in its coverage of the Druckenmiller-versus-Bessent clash, billionaire investor Stanley Druckenmiller called the plan a mistake in a Wall Street Journal op-ed, writing that “governments defending prices against fundamentals always lose,” while Bessent has defended the buybacks as routine liquidity operations. That backdrop of record debt and elevated long-term yields is the macro frame the metals are trading on.
Investor Takeaway
The metals, gold and silver, move so far is anticipation, not flow, since the larger buybacks do not begin until September 9, so the rally has been pricing a policy that has barely started.
Where Gold and Silver Are Now
Silver has had a year unlike almost any other asset. It blasted through $100 to a record $121.88 in January, crashed roughly 30% in a single session on January 30 when exchange margin hikes forced liquidations, ground down toward $58 by early August, then rallied hard from late July. It now trades around $67, up more than 100% year to date but consolidating in the high $60s, well below its January peak. That rebound has been a recovery off the August lows rather than a fresh breakout, which fits the anticipation read rather than contradicting it.
Silver has rebounded off its early-August low to consolidate in the high $60s, still far below its January record. Source: TradingViewGold has followed a milder version of the same arc. It touched records above $5,500 earlier in the year, pulled back through the spring and summer, and now trades near $4,450, holding a recovery of its own. The recent bounce in both metals has been supported by softer economic data, lower long-end Treasury yields, a weaker dollar, and central bank buying. For gold as for silver, the move is a rebound inside a violent year, not a return to the highs, which is the honest frame for a rally that is still front-running the September 9 flow.
Gold trades near $4,450, recovering off its summer lows but below the records it set earlier in 2026. Source: TradingViewThe Silver Supply Story: A Sixth Straight Deficit
Beneath the macro trade sits a physical one. Silver is on track for a sixth consecutive annual supply deficit in 2026, its structural underpinning, though the size estimates vary: the Silver Institute puts the 2026 deficit near 46 million ounces, while the Swiss bank UBS, in a May revision, pegged the global shortfall at roughly 60 to 70 million ounces, as summarized by Canadian Mining Report.
The common thread is that demand from solar, electronics, and AI-related infrastructure keeps outrunning mine supply, which responds slowly because roughly three-quarters of silver comes as a byproduct of copper, lead, and zinc mining. That physical squeeze is the reason silver tends to outrun gold when the macro turns risk-on, and it is a slower-moving support than any single buyback.
What to Watch on and After September 9, and What Would Break the Thesis
The date to diary is September 9, when the larger operations begin and anticipation meets actual flow. If long-end yields ease and hold as the bigger buybacks run, the metals bid gains a real mechanism behind it. If yields drift back up, as they did after the announcement, the rally loses its stated support.
UBS’s base case was that silver would “trade broadly sideways” for the rest of the year, and Fed Chair Kevin Warsh’s hawkish Jackson Hole remarks were a pointed reminder that the central bank can still raise the opportunity cost of holding a yieldless metal, the exact opposite of what the buyback is doing at the long end. So the Treasury and the Fed are pulling on different parts of the curve at once, and which force wins is what silver and gold are really trading.
Investor Takeaway
The Fed is the counterweight, because Warsh’s hawkish turn raises the opportunity cost of holding metal even as the buyback lowers it at the long end, so the rate path can override the buyback effect.